Memory leaks are my least favourite type of bug. To track them down requires not only a detailed knowledge of the entire codebase but also strong intuition (or a lot of luck). To make the process more fun I’ve written a patch for ruby 1.9.3 that lets you visualize portions of the memory graph.
ObjectSpace.each_object
Ruby already comes with ObjectSpace which contains a few methods for analyzing your program. The most useful for finding memory leaks is ObjectSpace.each_object which yields every single ruby object in your program.
counts = Hash.new{ 0 }
ObjectSpace.each_object do |o|
  counts[o.class] += 1
end
By dumping the counts into a file after each request and using diff it’s possible to determine what kind of objects are leaking. This is essential to know, but it doesn’t give you any insight into why they’re not being garbage collected.
ObjectSpace.find_references
The first step in getting more insight is to find everything that references the object that is being leaked. Ruby already knows how to calculate this information, as it’s needed for the mark and sweep garbage collection, but it doesn’t expose it to ruby code. The patches add a find_references method to ObjectSpace that returns an array of all objects that reference the object you’re looking for.
ObjectSpace.find_references(
  ObjectSpace.each_object(MainController).first
)
This works but it turns out to be far too fiddly for manual use while debugging. The main problem is that every time you run find_references the array that is returned adds a whole slew of additional bogus references. This pollutes the reference graph quickly, so you continually have to restart the process to flush these out.
ObjectGraph#view!
The next step is to recursively run find_references until you’ve generated a graph that shows all the ways in which your object is referenced. This is wrapped up by the ObjectGraph class, which takes care to avoid the bogus-references problem. The most useful thing this class can do is let you view! the graph using graphviz.
require 'object_graph'
ObjectGraph.new(9).view!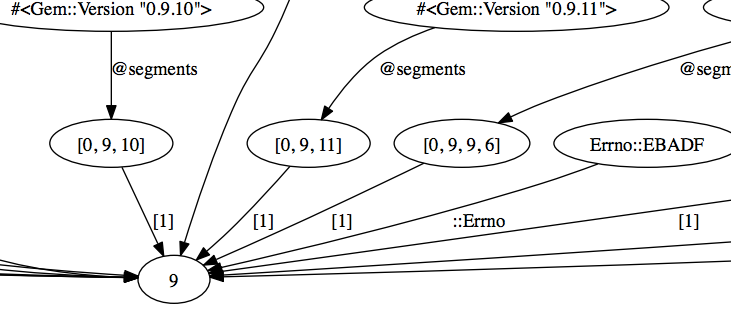
While 9 is a silly example it hopefully gives you a feel for how easy it is to reason about the resulting graph. You’ll notice that not only is each node labelled with the inspect output for the object, each edge is also labelled in a way that corresponds to how the reference was made. If you need programmatic access to this information then the annotated_edges method returns an array of edges along with their description.
Installation
My patches add both ObjectSpace.find_references and a new ObjectGraph standard library. If you want to use them you can either clone my repository and build the find-references branch yourself, or use one of the quick methods below:
Using rvm with a patch:
curl -L http://git.io/kRIgxw > references.patch
rvm install 1.9.3-p392-ref --patch ./references.patch
rvm use 1.9.3-p392-ref
Using rbenv with ruby-build:
curl -L http://git.io/4fQ9Jg > 1.9.3-p392-ref
rbenv install ./1.9.3-p392-ref
rbenv shell 1.9.3-p392-ref
Using chruby with ruby-build:
curl -L http://git.io/4fQ9Jg > 1.9.3-p392-ref
ruby-build ./1.9.3-p392-ref ~/.rubies/ruby-1.9.3-p392-ref
chruby 1.9.3-p392-ref
To get pretty pictures, you’ll also need to brew install graphviz or apt-get install graphviz.